
You sit down with last year’s numbers. The profit and loss says the business made a solid six-figure profit. You nod, then open the bank and wonder where it went. You paid suppliers, met payroll, covered tax, and kept the lights on. Yet money to reinvest, rebuild a cash buffer, or take a calmer drawing feels thin.
That gap frustrates many owner-operators. It is not usually a mistake in the accounts. It is the difference between net profit (an accounting result) and free cash (what was left after cash left for things the profit line does not show in one number). Going through that difference line by line is what cash reality is about.
What the profit-to-free-cash bridge includes
Start with net profit, the bottom line on the profit and loss after revenue, direct costs, and operating expenses. Then adjust for items that affect cash differently from accounting profit.
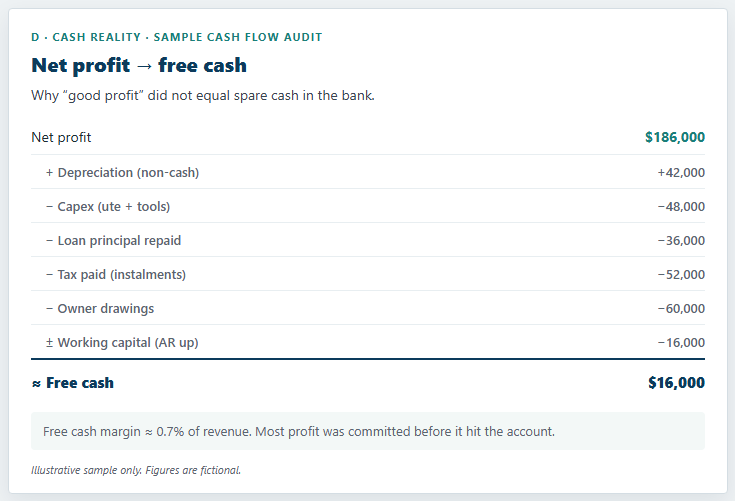
Depreciation is a non-cash expense. Your accountant spreads the cost of assets (vehicles, equipment, fit-out) over years. That reduces profit, but the cash already left when you bought the asset. So depreciation is typically added back on the bridge: it reduced profit without reducing this year’s cash in the same way.
Capital expenditure (capex) is cash spent on assets that last beyond the current year: a ute, machinery, computers, a fit-out. Capex often does not hit the P&L as one lump in the year you spend it; it hits the bank immediately. So you subtract it on the bridge. One vehicle or equipment purchase can wipe a year of free cash while depreciation trickles through slowly on the P&L.
Loan principal is the portion of debt repayments that reduces what you owe, not the interest. Interest usually appears as an expense on the P&L. Principal usually does not. Paying down a loan is financially sensible and still cash leaving the account, so it comes off free cash. Reducing debt is good, and it still drains cash.
Tax can differ in timing from the tax expense on the P&L. Instalments, refunds, and when assessments fall due all move cash on dates that may not match the accounting line. The bridge notes the cash effect, not only the expense.
Owner drawings (or dividends, depending on structure) are money you take out of the business. Legitimate and necessary for living, and still a reduction in free cash available to the company.
Working capital movements close the loop with debtor days, stock, and creditors. If customers owe you more at year end than at the start, profit this year may not be cash until next year. If you paid down creditors or built inventory, cash left even when profit looked strong. This is where liquidity and the cash conversion cycle meet the profit figure.
The result is a free cash figure: roughly, what was left after keeping the business running and meeting those obligations. For illustration, about $186,000 of net profit might bridge down to roughly $16,000 of free cash. The P&L was not wrong. Cash had gone to places the profit line does not show in one number. Net profit rarely equals the rise in the bank account, and that is normal.
Better questions to ask
Rather than “Where did the profit go?”, ask:
- Of this year’s net profit, how much became free cash after capex, loan principal, tax, drawings, and working capital?
- Which single line on that bridge is the largest gap?
- Are we choosing that gap (debt reduction, investment, drawings), or is it an unintended leak (slow collections, stock build)?
That keeps the discussion practical. Sometimes the answer is to slow drawings until a three-month cash buffer rebuilds. Sometimes it is timing capex differently. Sometimes it is collections. The bridge tells you which conversation to have first.
How this shows up in a Cash Flow Audit
A Cash Flow Audit sets out the profit-to-free-cash bridge on one page, next to liquidity (cash versus a spend buffer), working capital (the cash conversion cycle), and the margin snapshot. Together they support a clear verdict, for example amber: profitable on paper, cash still gets tight, and a short list of next steps. It is historical diagnosis, not a forward forecast.
If you want that full four-part picture on your numbers, with a clear next-step list, apply for a Cash Flow Audit or enquire about Wayfarer Pro.
This series: liquidity, working capital, profitability, and cash reality. That closes the set.