
It is late on a Thursday. Payroll clears tomorrow, a large supplier invoice is due Monday, and you open the banking app. There is a solid six-figure balance staring back at you. You feel a brief wave of relief, then the familiar unease. Last month looked similar, and by the third week you were still juggling which bills could wait.
The balance tells you what is in the account today. It does not tell you whether that amount is enough for how your business actually spends money. That is what liquidity is about.
In plain English, liquidity means how readily your cash can cover the outflows you already know are coming, without relying on a perfect month of collections. The practical test many owner-operated businesses use is a 3-month spend buffer: enough cash on hand to cover roughly three months of ordinary operating outflows if revenue slowed or customers paid late.
What the 3-month spend buffer is
Start with your cash outflows: the money that actually left the bank for wages, subcontractors, rent, suppliers, tax instalments, and the other costs of keeping the doors open. Take the average of those monthly outflows over a recent period (often the last three months), then multiply by three. That product is your buffer figure.
It is not a forecast of the future. It is a historical health check: if sales dipped or invoices sat unpaid for a stretch, would the cash you usually hold cover ordinary spend for about a quarter? If your balance sits comfortably above that line most weeks, you have room to absorb a bump. If it dips below regularly, cash will feel tight even when the profit and loss statement looks fine.
A single week’s balance can also look stronger than it is. A large invoice payment can lift the account for a few days; peak cash after a good collection run can feel like the normal position when it is often the exception. The more useful picture is how often you sit near the bottom of the range, and whether that matches the shape of your outflows. A services business with a large wage or subcontract bill every fortnight needs a different buffer conversation from one with lumpy project costs or seasonal stock purchases.
For illustration, imagine average monthly outflows of about $104,000. The three-month buffer is then around $312,000. Suppose cash sat below that level in 9 of the previous 52 weeks. The profit figure might still look respectable. The owner would still feel the squeeze more often than the P&L suggests, because the bank account kept crossing under a practical floor.
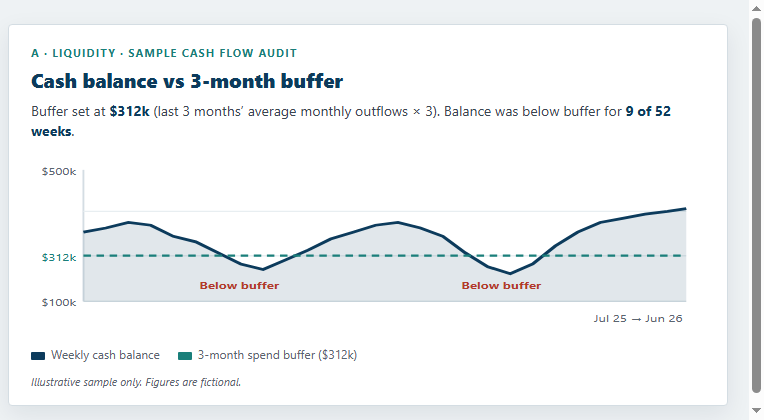
Liquidity also answers a different question from profitability. You can be profitable on paper and still run amber on cash. That combination is common: the business makes money, but the bank account still gets tight in ordinary weeks.
Better questions to ask
Instead of “How much is in the bank?”, try:
- In how many of the last 52 weeks was cash below a three-month spend buffer?
- When it dipped, how long did it stay there?
- Are drawings, tax, or large supplier payments the main reason we fall under the line?
Those questions turn a single snapshot into a pattern. Patterns are what you can act on: tightening collections, smoothing supplier terms, holding owner drawings until the buffer rebuilds, or timing discretionary spend differently.
You do not need to become a finance person to use this. You need one clear line (the buffer) and an honest count of how often you cross it.
How this shows up in a Cash Flow Audit
A Cash Flow Audit, in the sense used here, is a one-page historical review of cash health. The liquidity panel puts your cash balance against that three-month spend buffer and shows how often you were underneath it. You get a plain read (roughly green, amber, or red) and a short note on what that implies for the next decisions you make.
It sits beside other views of cash timing, margin, and the gap between profit and free cash. Together they explain why a balance that looks fine on Tuesday can still feel fragile by Friday.
If you want this buffer check on your own numbers, with a clear next-step list, apply for a Cash Flow Audit or enquire about Wayfarer Pro.
Next in this series: Where cash gets stuck: working capital and the cash conversion cycle.