
Your accountant sends the year-to-date profit and loss. Revenue is up on last year. There is a net profit line at the bottom, and it is positive. You exhale, then wonder why the business still feels harder to run than the number suggests. You are busier. The team is stretched. Yet the surplus does not feel as solid as the percentage on the page.
Cash timing explains some of that gap. The rest often sits in margin: how much of each dollar of revenue you keep after the costs of delivering the work and running the organisation. “We’re profitable” is a yes/no. A margin snapshot tells you where the profit is made or lost.
What the margin snapshot shows
Going from the top of the profit and loss down to the bottom is familiar once each step is defined in plain English:
Revenue → direct costs → gross profit → operating expenses → net profit
Revenue is what you billed (or recognised) for the work and products you sold. It is the starting point, not the finish line.
Direct costs (sometimes called cost of sales or cost of goods sold) are the costs closely tied to delivering that revenue: materials, subcontract labour on jobs, freight on sold goods, and similar. If you did not do the work or make the sale, these costs would largely fall away.
Gross profit is revenue minus direct costs. Gross margin is that amount as a percentage of revenue. It answers: after the cost of delivering the work, how much is left to run the business and still have something left over?
Operating expenses (OpEx) are the costs of running the organisation: rent, admin wages, software, insurance, marketing, professional fees, and the rest of the overhead that does not sit neatly in direct costs. These keep the business going whether a particular job is on or off.
Net profit is what remains after OpEx (and other items your accountant includes at that level). Net margin is net profit as a percentage of revenue. It answers: after delivering the work and running the organisation, how much is left?
Both margins matter. A strong gross margin with heavy overhead can still leave a thin net. A modest gross with tight OpEx can still deliver a workable net. The snapshot exists so you can see which layer is carrying the business and which is dragging it. Pricing and delivery cost live in gross; overhead rhythm lives in OpEx. The fix for each is different.
More sales at a worse mix can also leave you busier and no better off. A shift toward lower-margin work, or heavier use of subcontractors, can move the needle more than a price rise elsewhere can fix. That is why the snapshot looks at the layers, not only the final percentage.
For illustration, imagine revenue of about $2.41 million and a net margin of roughly 7.7%. The drag in that example might sit in subcontract labour inside direct costs, not a vague “costs are high,” but a specific line that compressed gross margin and flowed through to net. The conversation then becomes concrete: mix of work, pricing, when to hire, or how subcontractors are used.
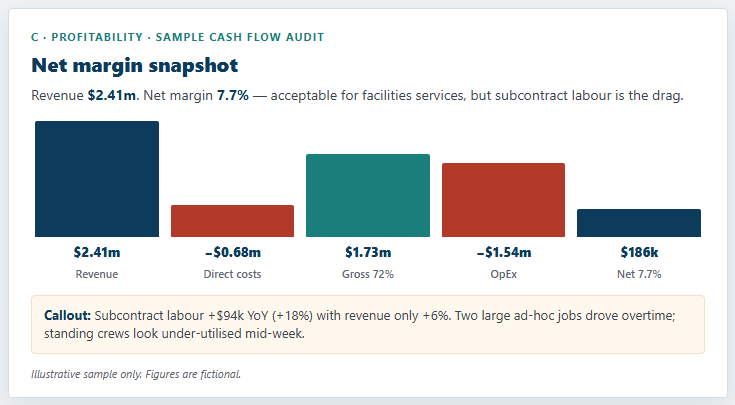
Profitability also gets confused with cash. A business can show a solid net margin and still run amber on liquidity if receivables are slow or owner drawings take a large bite. That is why a proper cash health review separates margin from bank-balance and free-cash views.
Better questions to ask
Instead of “Are we profitable?”, ask:
- What is our net margin, and which line between revenue and net has moved most in the last year?
- Is the drag in direct costs (delivery) or in OpEx (overhead)?
- Has our mix of work changed in a way that quietly reduced gross margin?
Those questions keep the discussion concrete. If subcontract labour is the drag, the next conversation is about mix, pricing, or hiring. If OpEx is the drag, the conversation is about overhead rhythm and what is non-negotiable versus discretionary.
How this shows up in a Cash Flow Audit
A Cash Flow Audit lays out the margin snapshot in one view: revenue, direct costs, gross, OpEx, and net, with the key percentage and a short note on the main driver or drag. You leave knowing whether profit is genuinely healthy, thin, or sitting on a fragile mix.
It sits beside the cash buffer and working capital panels so margin is never read in isolation from timing.
If you want this margin snapshot on your numbers alongside cash buffer and working capital, with a clear next-step list, apply for a Cash Flow Audit or enquire about Wayfarer Pro.
Next in this series: Why profit is not cash: the free cash bridge.